Keeping Watch: Monitoring My Network with TELEGRAF
How I visualise network performance with Grafana, Prometheus and Telegraf so we can enjoy gaming marathons and 4K streaming sessions without a hitch!
Network monitoring has become important for us, especially with all the remote work during lockdowns. My wife, who's a lecturer, basically lived on Teams for her lectures. So, we've had to make sure our network can handle our gaming marathons and 4K streaming sessions without a hitch.
What to monitor?
Most of the pre-configured dashboards you find for Grafana are full of irrelevant graphs. My main focus is to monitor the network latency. Telegraf is my weapon of choice. It allows me to monitor latency, packet loss and DNS resolution.
How does Telegraf work?
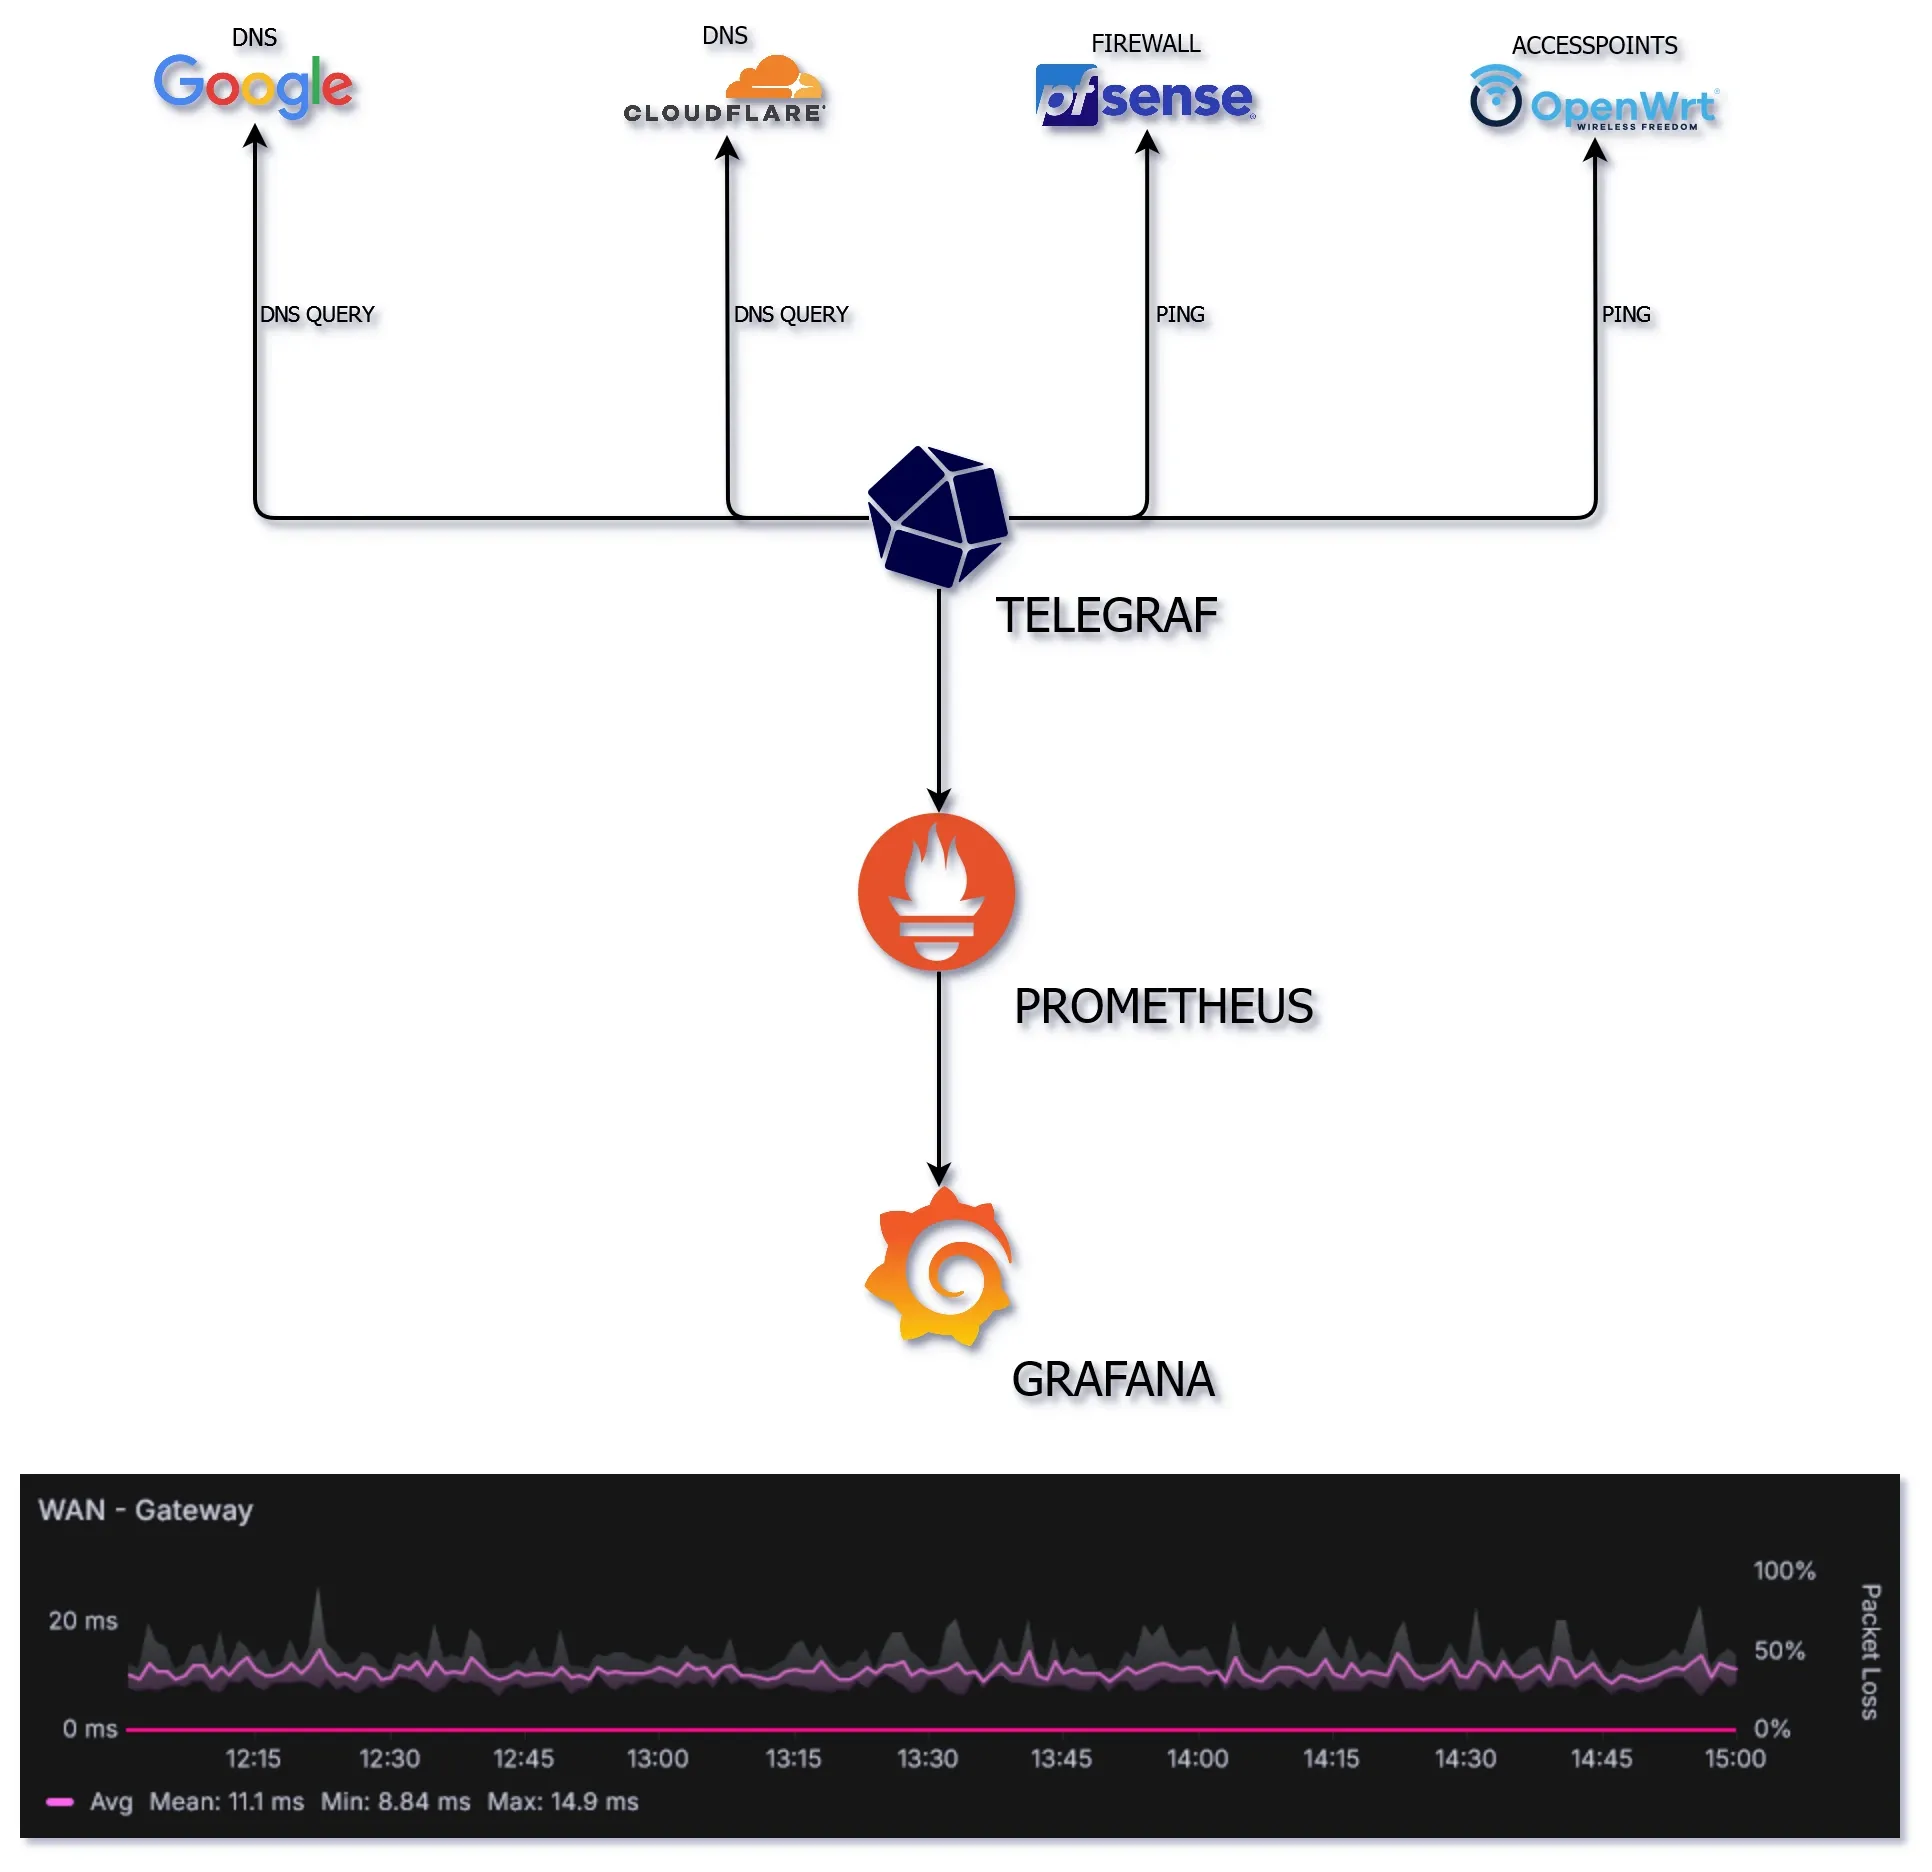
Telegraf is a lightweight server agent designed for collecting, processing, and reporting metrics. Telegraf uses a plugin-based architecture, like Ping and DNS Query, where each data source or metric type is handled by a separate plugin. This allows Telegraf to be highly flexible and extensible, supporting a wide range of data sources and output formats.
- The DNS plugin gathers dns query times in milliseconds - like Dig
- The Ping plugin sends a ping message by executing the system ping command and reports the results.
Telegraf setup
To setup Telegraf it involves editing the Telegraf configuration file (usually located at /etc/telegraf/telegraf.conf) and adding configuration blocks for Input Ping and Input DNS Query. This is my config:
[[inputs.ping]]
  interval =  "15s"
  method = "native"
  timeout = 2.0
  count = 4
  urls = [
    "172.16.99.1", # pfSense Firewall
    "172.16.99.2", # Mikrotik CRS326
    "172.16.99.3", # OpenWrt-Livingroom
    "172.16.99.4", # OpenWrt-Utility
    "172.16.99.5", # OpenWrt-Bedroom
    "172.16.99.6", # OpenWrt-Attic
    "172.16.20.5", # Intel NUC Pro
    "cloudflare.com", # DNS Query
    "google.com", # DNS Query
    "reddit.com", # DNS Query
    "twitter.com", # DNS Query
    "***.***.***.*" # WAN Gateway
  ]

[[inputs.dns_query]]
servers = ["172.16.20.1"]
domains = ["cloudflare.com", "google.com", "reddit.com", "twitter.com"]

[[outputs.prometheus_client]]
  listen = "172.23.0.2:9273"
Here is an example of the metrics generated by Telegraf Ping:
rudolf@gringotts:~$ curl 172.23.0.2:9273/metrics |
grep 'url="cloudflare.com"' | head
  % Total    % Received % Xferd  Average Speed   Time    Time     Time  Current
                                 Dload  Upload   Total   Spent    Left  Speed
100 15813    0 15813    0     0  9956k      0 --:--:-- --:--:-- --:--:-- 15.0M
ping_average_response_ms{host="9b216f136c72",url="cloudflare.com"} 16.091742
ping_maximum_response_ms{host="9b216f136c72",url="cloudflare.com"} 17.548752
ping_minimum_response_ms{host="9b216f136c72",url="cloudflare.com"} 14.233287
ping_packets_received{host="9b216f136c72",url="cloudflare.com"} 4
ping_packets_transmitted{host="9b216f136c72",url="cloudflare.com"} 4
ping_percent_packet_loss{host="9b216f136c72",url="cloudflare.com"} 0
ping_result_code{host="9b216f136c72",url="cloudflare.com"} 0
ping_standard_deviation_ms{host="9b216f136c72",url="cloudflare.com"} 1.336313
ping_ttl{host="9b216f136c72",url="cloudflare.com"} 56
Resources for Telegraf Configuration options:
Grafana graph setup
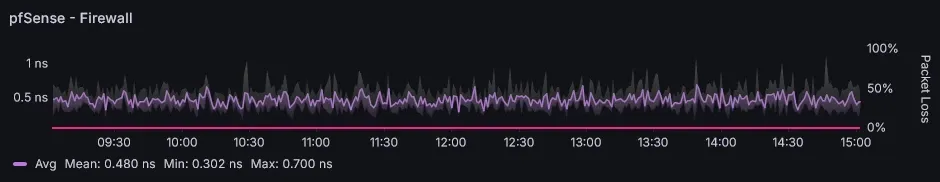
The idea was to create a graph that is similar to Smokeping
Example:
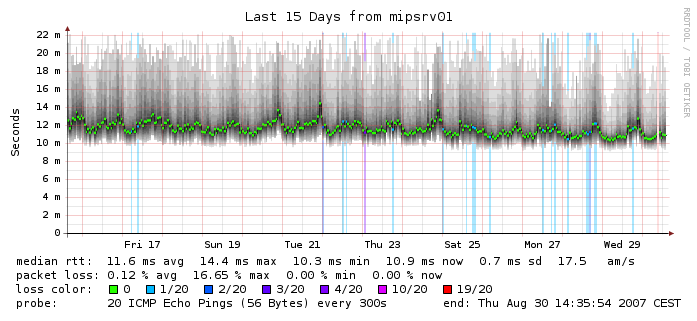
Smokeping combines avg, max, min, now values in a single graph along with packet loss. It provides a large amount of information from a single target.
Panel query
I created a panel in Grafana with four queries:
ping_minimum_response_ms{url="google.com"}
ping_average_response_ms{url="google.com"}
ping_maximum_response_ms{url="google.com"}
ping_percent_packet_loss{url="google.com"}
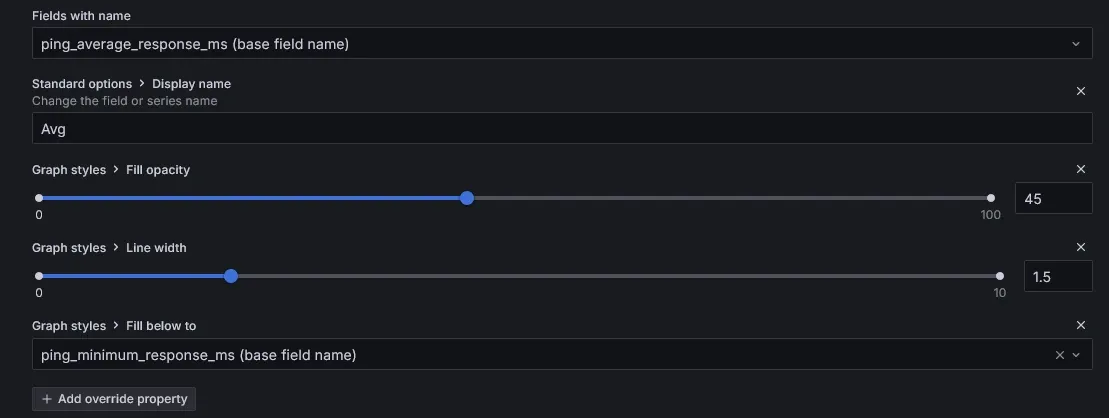
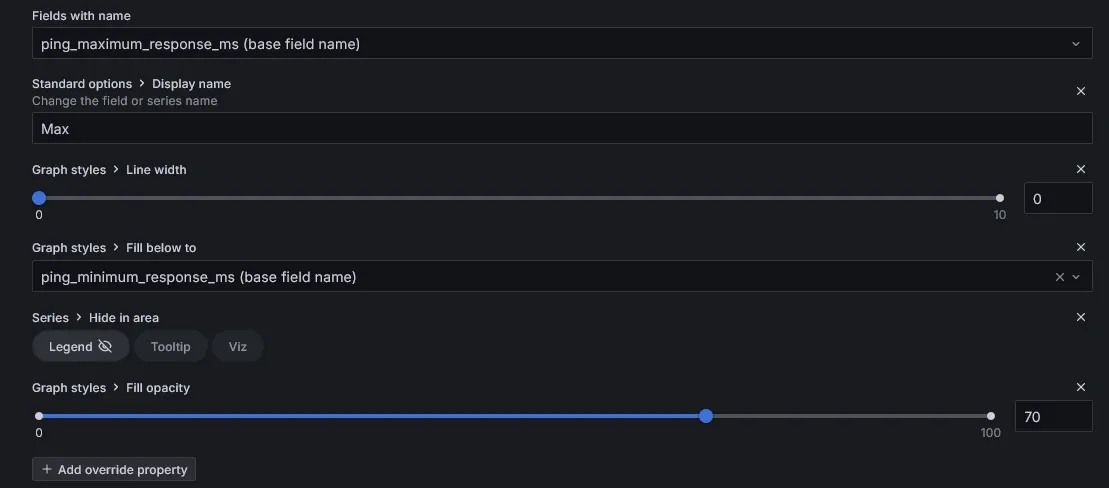
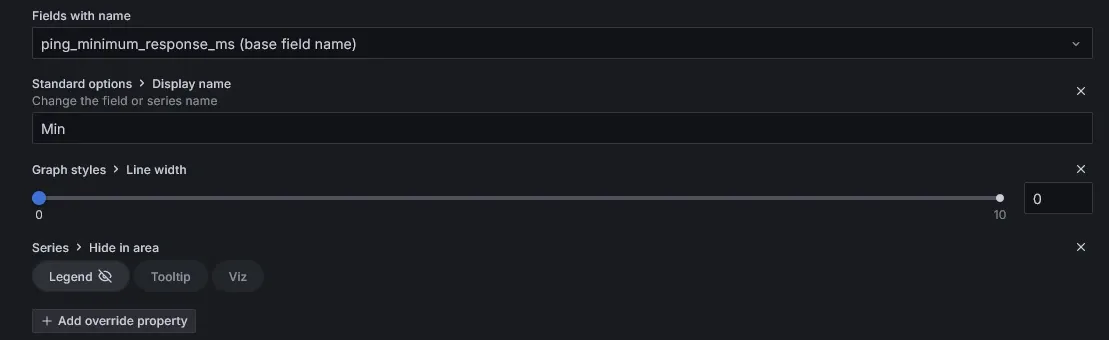
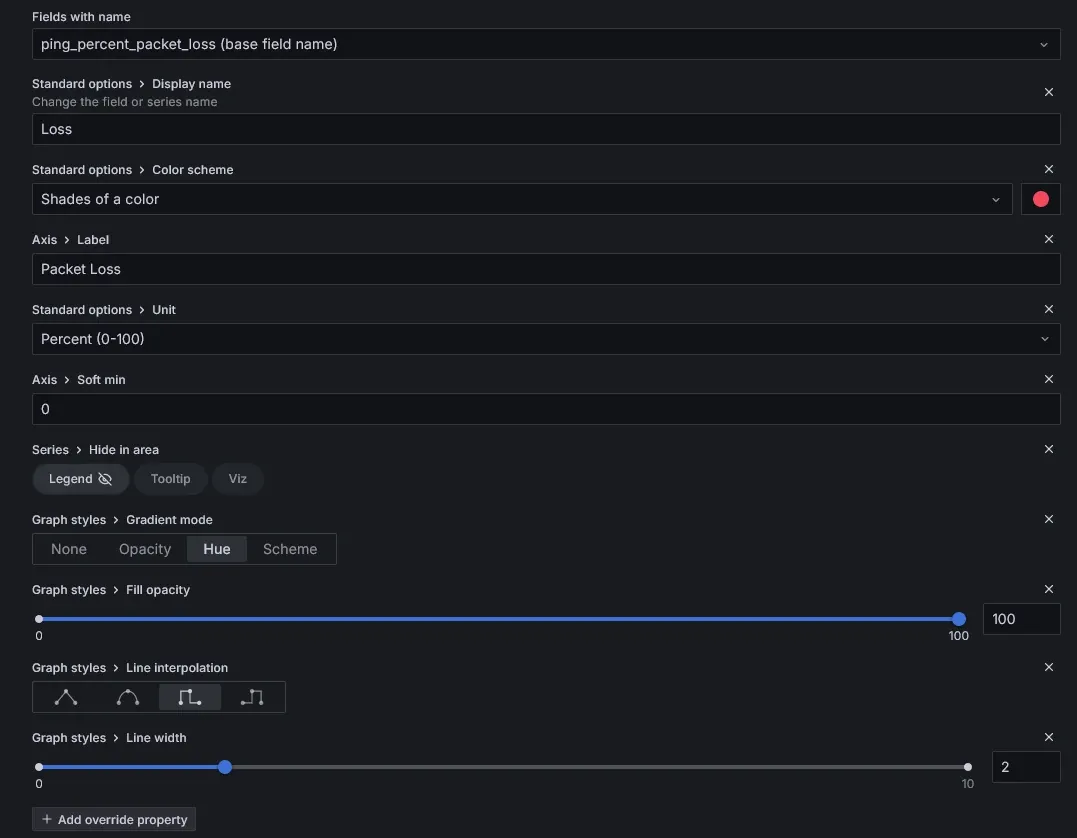
To create the Ping graph with min, max, avg and packet loss you have to override the queries:
Alerting
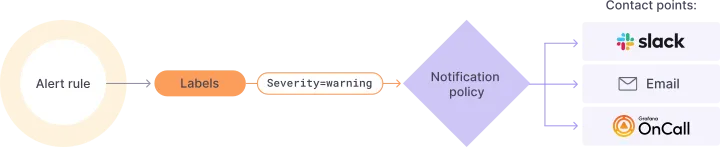
Grafana has the option to create alerts to help you identify issues almost immediately after they occur. I use the Grafana Alerting - Telegram integration to send Telegram notifications on my phone when alerts are firing.
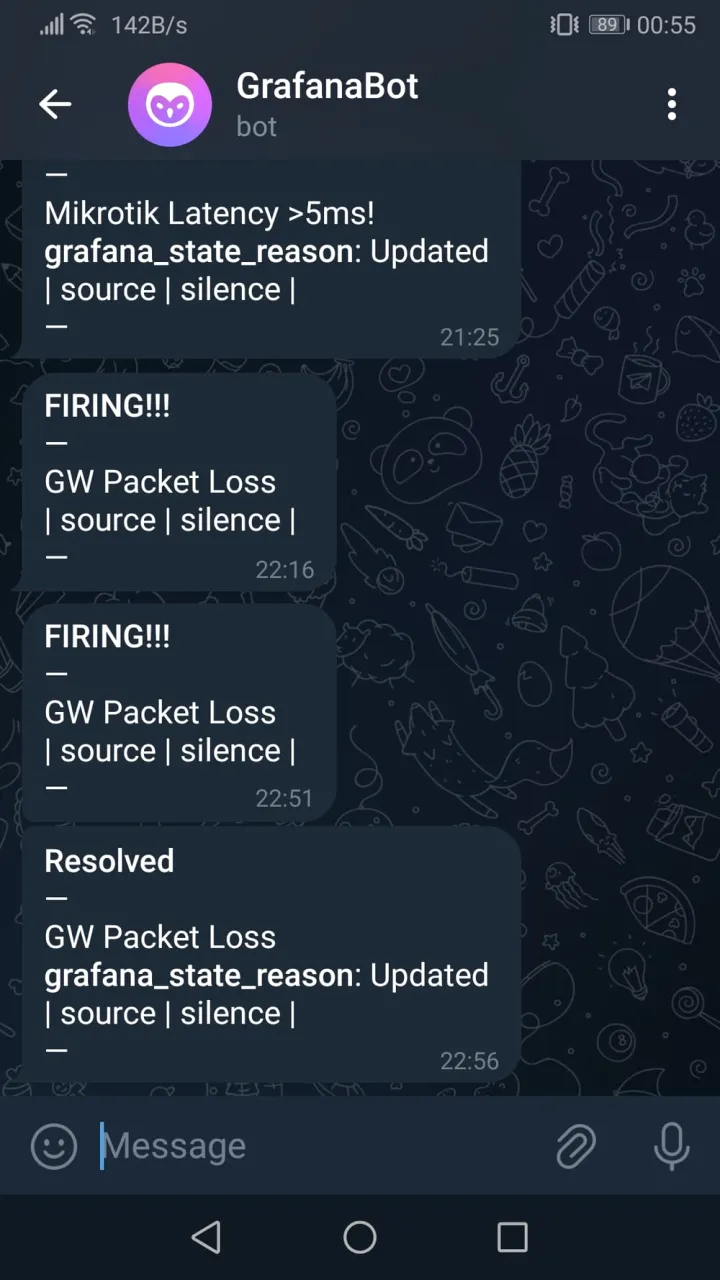
Telegram Bot
My Telegram Bot that is configured to alert me when network devices experience high latency or packetloss. Alerts are defined with queries and alert conditions. For example if the average latency from a network device reports a higher value over a 5 minute interval it will trigger a alert.
Results


I use Telegraf to keep on eye on several devices and addresses: my pfSense firewall, my ISP's gateway, and both Google and Cloudflare IP addresses. This helps me identify packet drops and diagnose issues. Typically, I can check if the problem lies within my network or further along the route. When I see packet loss on the Google DNS but smooth sailing to my gateway, I know my connection's not the culprit.
My Telegram Bot alerts me with notifications on my phone wich is an added bonus, even if its complex to setup and configure. In a later article I will dive deeper into this topic.
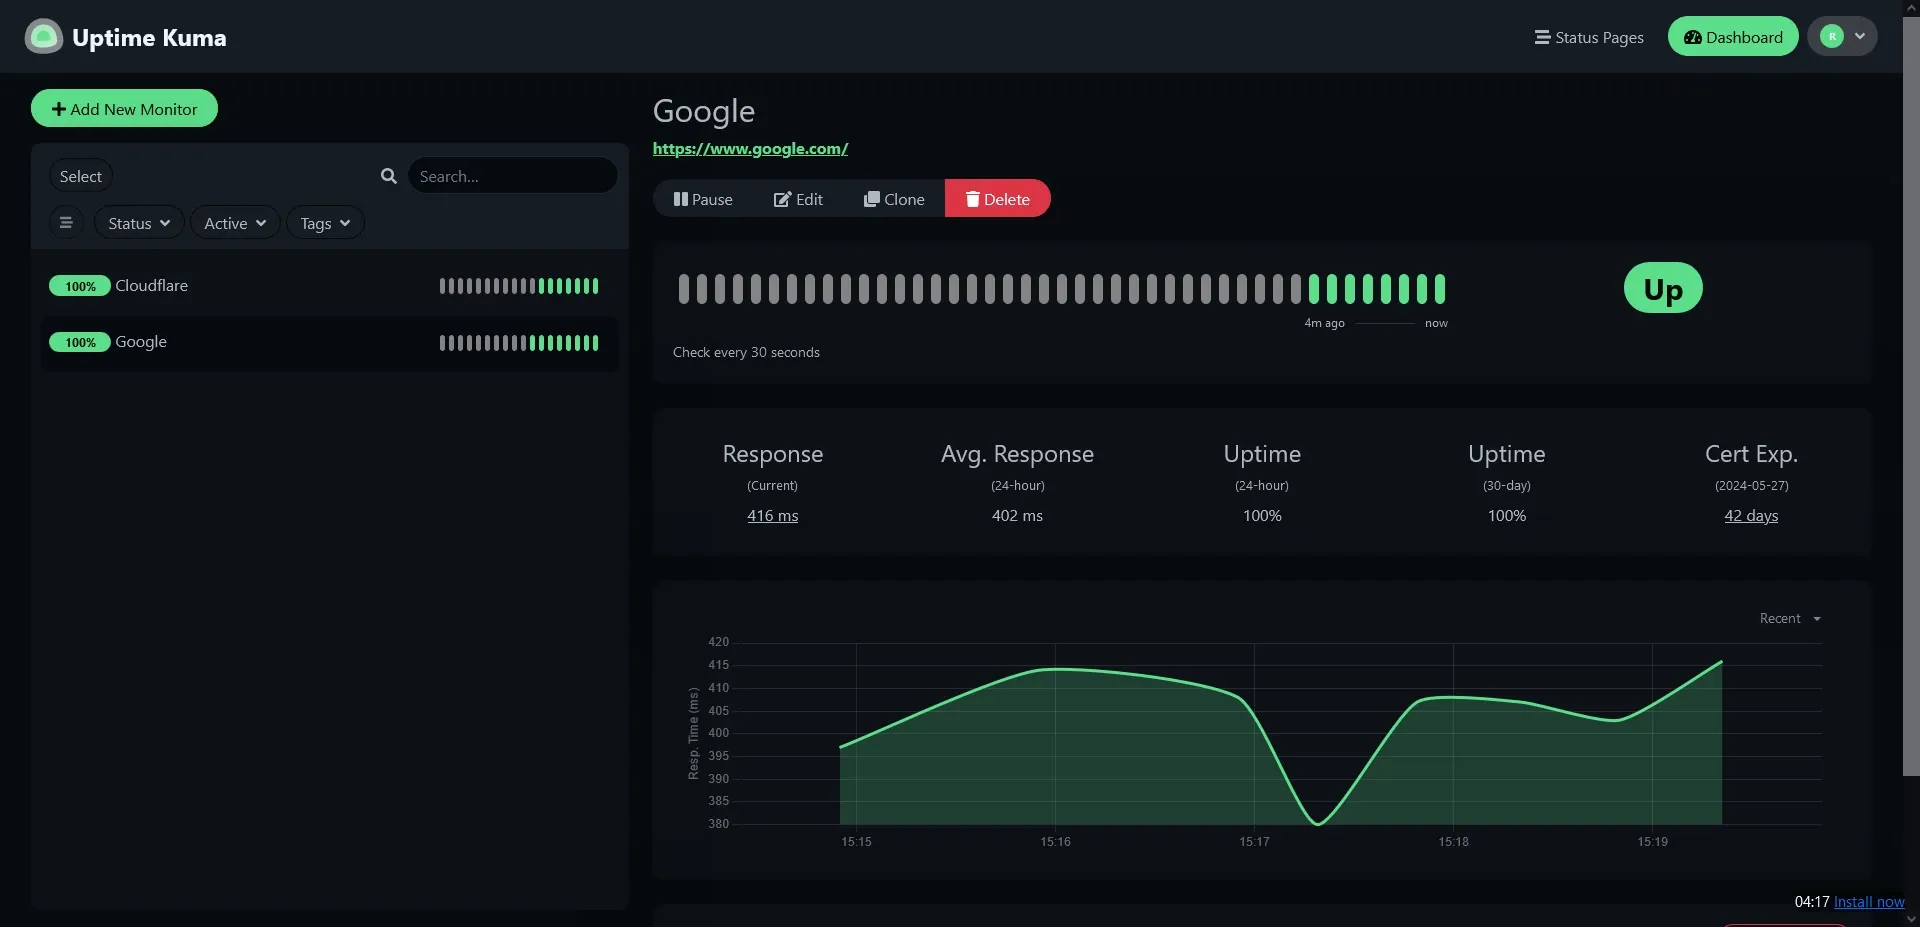
Alternative to Grafana
If you simply want to monitor application uptime and dont want bother with Telegraf -> Prometheus -> Grafana you can use Uptime Kuma.
Uptime Kuma
Uptime Kuma has an added bonus that it supports notifications via Telegram, Discord, Gotify, Slack, Pushover, Email (SMTP), and 90+ notification services, click here for the full list.