Monitoring Application Logs
Build a Kibana dashboard to monitor Kubernetes container logs in your homelab EFK stack. A real-time, searchable alternative to Dozzle.
Now that we finally have the whole EFK stack running we can start building our first dashboard.
elasticsearch-0                       1/1     Running   0               22h
fluent-bit-454d4                      1/1     Running   0               23h
fluent-bit-8bbpt                      1/1     Running   0               23h
fluent-bit-t2t7v                      1/1     Running   0               23h
kibana-7789c49774-nhvpq               1/1     Running   0               23h
The first dashboard is inspired by Dozzle. Where you can stream logs real-time from running containers for troubleshooting. This can be easily accomplished with Dozzle but there are some differences.
| Dozzle | EFK | |
|---|---|---|
| Deployment | Extremely easy | Complex |
| Real-time log trailing | ✅ | ✅ |
| Log retention | ❌ None | ✅ Fully customizable |
| Filtering | Basic | Full-text search, structured filtering |
| Visualizations | ❌ | ✅ Graphs, dashboards, time-series |
| Cross-pod/namespace search | ❌ | ✅ |
| Logs survive container restart | ❌ | ✅ |
| Resource usage | Lightweight | ✅ |
Setup:
In the EFK Part 3 Kibana Data View we created a Data View. To create a dashboard to monitor application logs we need to do the following:
- Create a Discover Session
- Build the Dashboard
- Add
Controls - Add
Visualization - Add
Time slider control
- Add
- Test with fake logs
Create a Discover Session
- Open the discover session and toggle the dialog, then pin the following columns:
@timestamp,kubernetes.container_name,kubernetes.namespace_nameandlog
- Create filters by
Adding filter, then create a filter for Field:NamespaceOperator:is notand Field:flux-systemto exclude fluxsystem and add another filter for Field:NamespaceOperator:existsto exclude null fields.
- Change column names by clicking the column header for the field, and then select
Edit data view fieldand checkSet custom label, then enter the Custom labels. Rename@timestamptoTime,kubernetes.container_nametoContainerandlogstoLog
Creating an Application Dashboard
Now that we have Data indexed in Elasticsearch and we have our data view configured we can create a new dashboard.
- Open the
Dashboardspage in Kibana, SelectCreate dashboardand populate the dashboard with our existing Discover Session by selectingAdd from library
Adding Controls will allow us to filter and display data based on container and namespaces
- In
Editmode, selectAdd>Controls>Controlin the toolbar, create a control forkubernetes.namespace_nameand then create a control forkubernetes.container_name
Adding a visualization that displays a Count of records will give us a record count per minute. This allows us to view peaks in record count that could indicate issues.
- In
Editmode, selectAdd>Visualization. On theHorizontal AxisselectDate Histogramthen inFieldselectTimewith aMinimum intervalofMinute. On theVertical AxisselectCountthen setFieldtoRecords
In addition to the Count of records visualization we can add a Time Slider Control lets us filter the data within a specified range of time.
- In
Editmode, selectAdd>Controls>Time slider controlin the toolbar.

Creating Fake logs
In order to view container logs I created a busybox Pod that creates fake warnings:
apiVersion: v1
kind: Pod
metadata:
  name: fake-log-generator
  namespace: monitoring
spec:
  containers:
  - name: log-gen
    image: busybox
    command: ["/bin/sh", "-c"]
    args:
      - |
        while true; do
          echo "$(date) [WARNING] Fake warning: high memory usage detected"
          echo "$(date) [ERROR] Fake error: connection timeout to upstream service"
          echo "$(date) [CRITICAL] Fake critical: disk threshold exceeded"
          sleep 5
        done
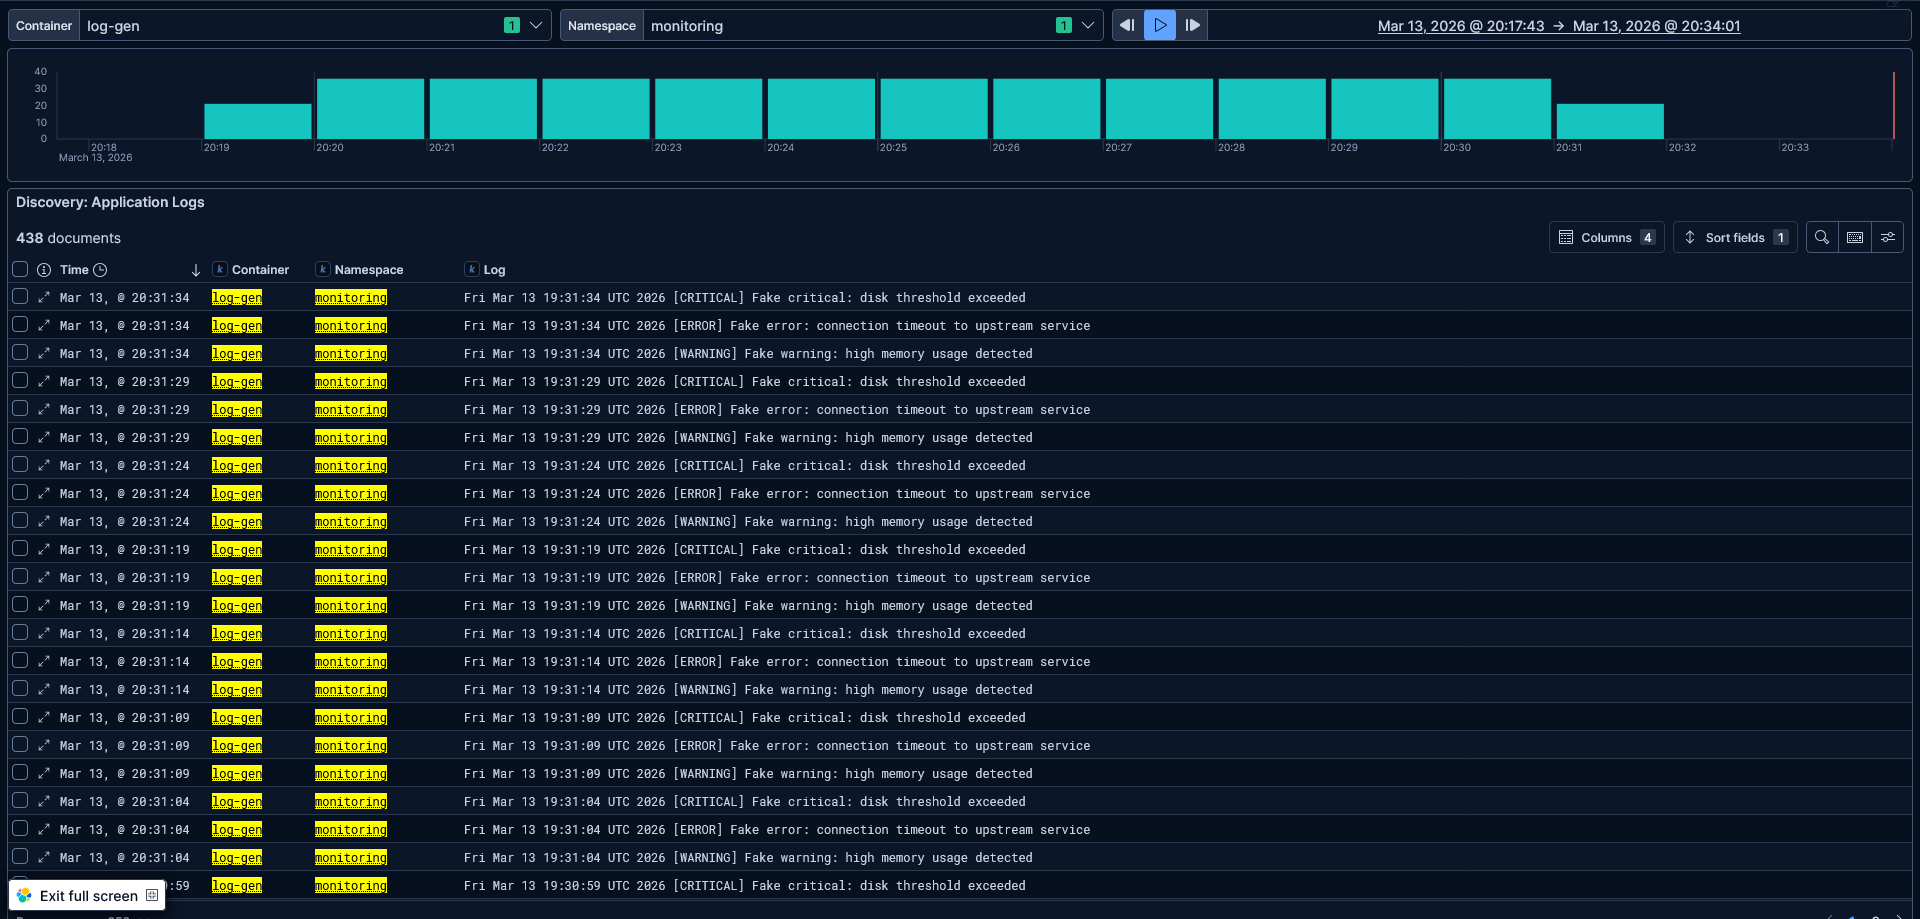
This pod creates fake warnings every 5 seconds allowing us to use the controls to select the log-gen container in the monitoring namespace.
4. Conclusion
And that's it! Now I have a Kibana dashboard that gives me a live, searchable window into my container logs. By pinning the filters I am able to focus on the container logs. With the Counts of records visualization I can spot irregularities and use the Time slider control to focus on a specific range of time.
Adding controls for the namespace and container name on top of that allows me to pivot between services in seconds.
It's a lot more to setup than running Dozzle, no doubt about that. Next post in this series, I will be building on the same foundation to set up two more dashboards. First is a dedicated FluxCD monitoring dashboard to follow reconciliation loops, Kustomization failures etc.
After that I will build a Kubernetes Events dashboard that will allow insights into pod scheduling failures, OOMKills, backoff loops, and more.