EFK Part 3 Kibana
Deploy Kibana on Kubernetes with a LoadBalancer & custom pfSense DNS. Visualize your EFK stack logs locally at kibana.local.lan in your homelab.
The last part of the EFK stack is Kibana. Kibana is used to visualize and query the logs stored in Elasticsearch.
How to configure Kibana
Kibana is configured using a Deployment with a LoadBalancer Service. I opted out of telemetry and left the username and password empty. This is of course for my homelab purpose. Production environment would typically have the credentials along with xpack.security enabled.
1. Deployment
apiVersion: apps/v1
kind: Deployment
metadata:
  name: kibana
  labels:
    app: kibana
spec:
  replicas: 1
  selector:
    matchLabels:
      app: kibana
  template:
    metadata:
      labels:
        app: kibana
    spec:
      containers:
      - name: kibana
        image: docker.elastic.co/kibana/kibana:9.3.0
        ports:
        - containerPort: 5601
        env:
        - name: ELASTICSEARCH_HOSTS
          value: "http://elasticsearch.monitoring.svc.cluster.local:9200"
        - name: ELASTICSEARCH_USERNAME
          value: ""
        - name: ELASTICSEARCH_PASSWORD
          value: ""
        - name: TELEMETRY_OPTIN
          value: "false"
        - name: TELEMETRY_ALLOWCHANGINGOPTINSTATUS
          value: "false"
        - name: TELEMETRY_SENDUSAGEFROM
          value: "server"
        - name: XPACK_APM_TELEMETRYCOLLECTIONENABLED
          value: "false"
        resources:
          requests:
            memory: "2Gi"
            cpu: "250m"
          limits:
            memory: "2Gi"
2. LoadBalancer Service
apiVersion: v1
kind: Service
metadata:
  name: kibana
spec:
  selector:
    app: kibana
  type: LoadBalancer
  loadBalancerIP: 172.16.10.70
  ports:
  - port: 80
    targetPort: 5601
I am trying something new with this Kibana deployment by assigning a loadBalancerIP. This makes it easy to configure a Host Override in the pfSense DNS Resolver that creates a custom local DNS record to map the loadBalancerIP 172.16.10.70 to kibana.local.lan.
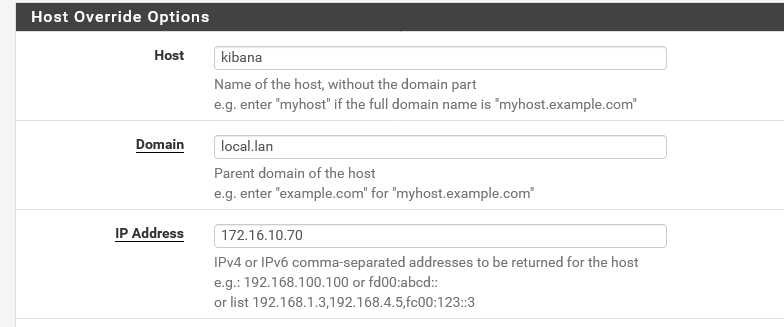
This eliminates the use of a nodePort service to access the deployment, allowing me to access it locally with at kibana.local.lan or through the WireGuard Full VPN Tunnel. When connected to the WireGuard Split Tunnel I can still access it with the loadBalancerIP giving me the flexibility to use both.
The loadBalancerIP address if picked from the following MetaLLB server pool:
MetalLB server pool
apiVersion: metallb.io/v1beta1
kind: IPAddressPool
metadata:
  name: server
  namespace: metallb-system
spec:
  addresses:
  - 172.16.10.60-172.16.10.250
  autoAssign: true
  avoidBuggyIPs: false
Kibana does not require a Persistent Volume Claim(PVC)because all results are stored in the indices managed byElasticsearch
3. Creating a Data View
Kibana needs a Data View to access the Elasticsearch data that we want to explore.
- Navigate to Stack Management > Data Views
- Click "Create a data view"
- Enter the name:
fluentbit - Enter index pattern:
fluentbit-* - Select timestamp field:
@timestamp - Save the data view
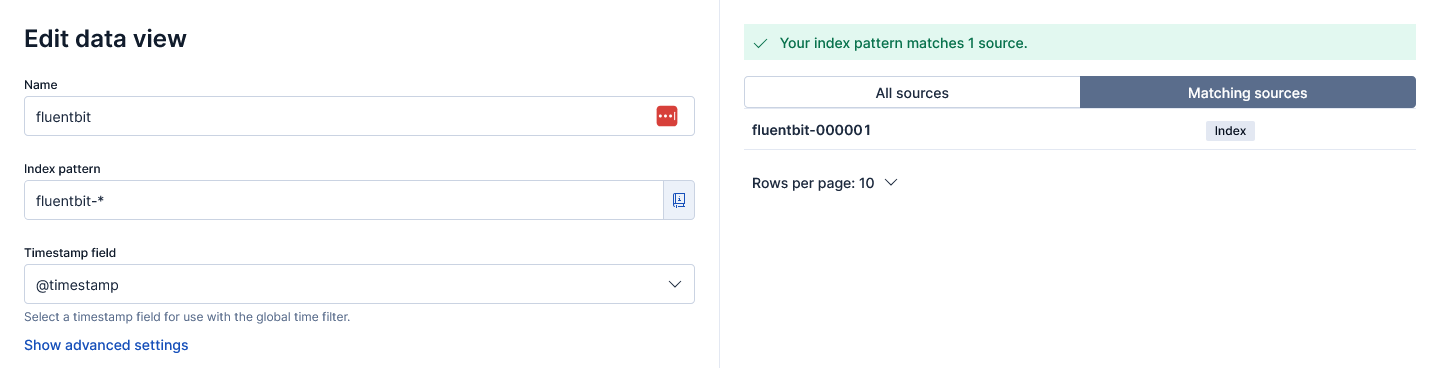
This Data View matches multiple sources (indices) matching fluentbit-*4. Discovering logs
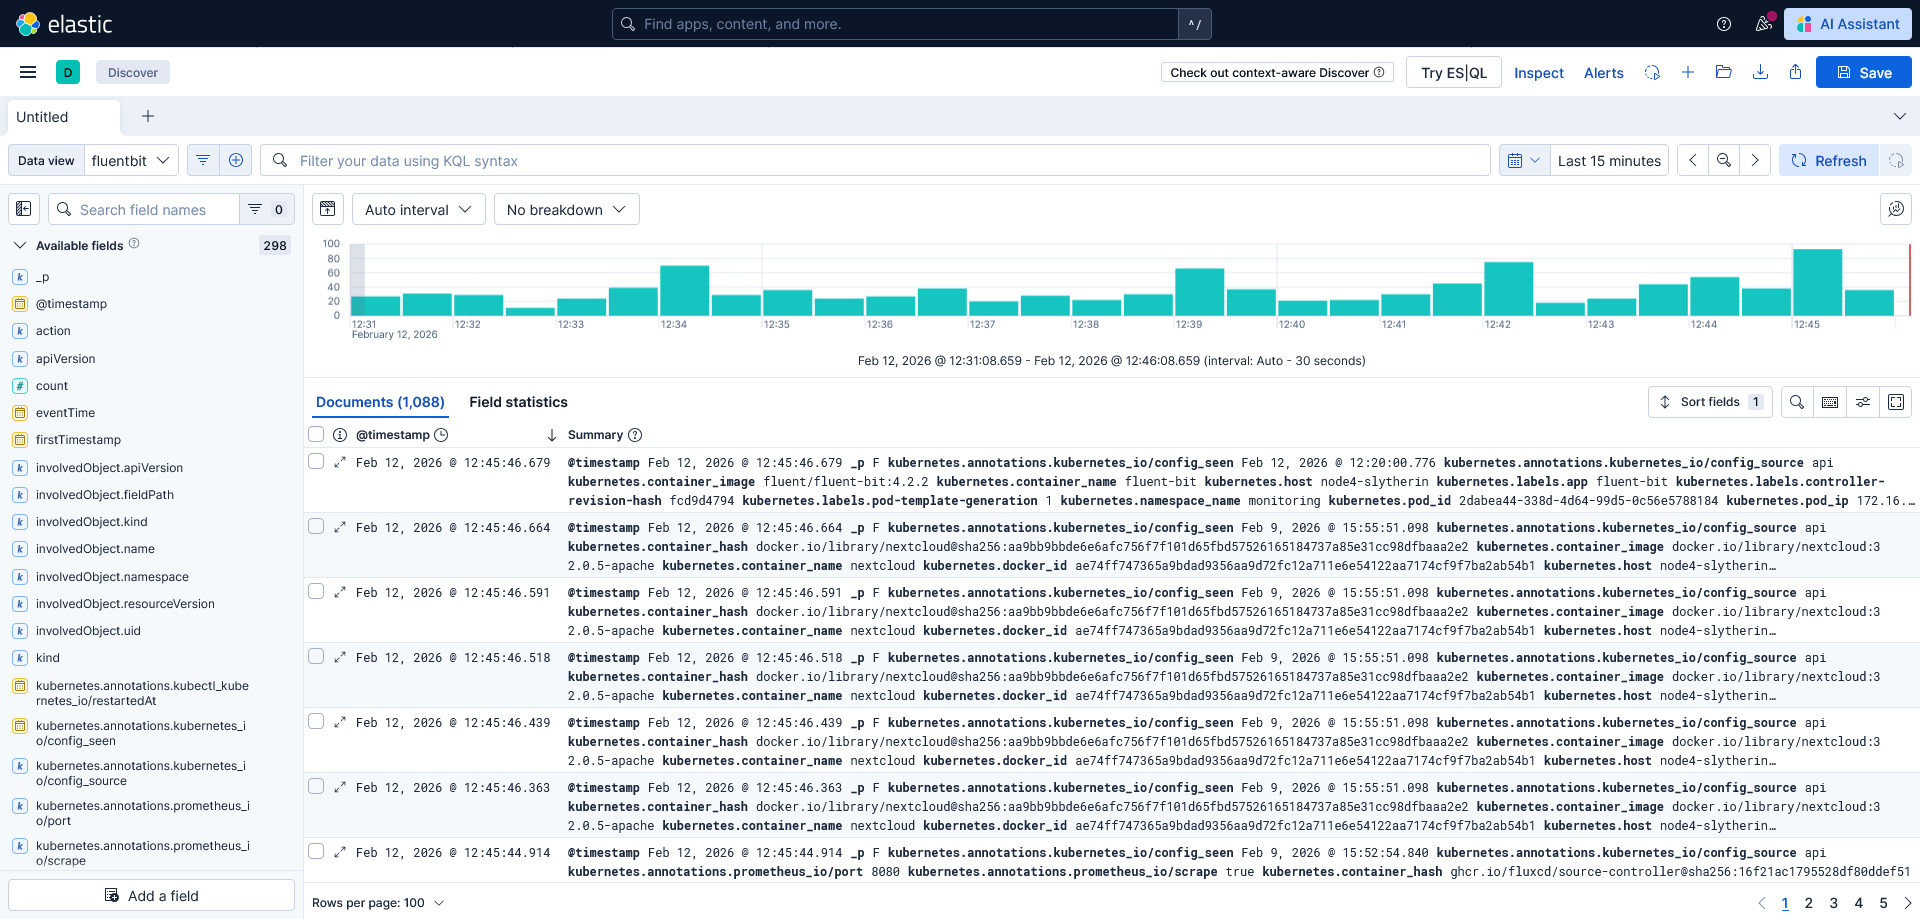
When we head over to the Analytics > Discover we should be able to select the Data view fluentbit we just created.
5. Wrapping up
This EFK stack provides the basis for extensive logging for kubernetes. With deployed it with minimal security features enabled for homelab purposes. We created a basic Index Lifecycle Management that rolls over after 1 day (or 1GB) and removes indices older than 7 days.
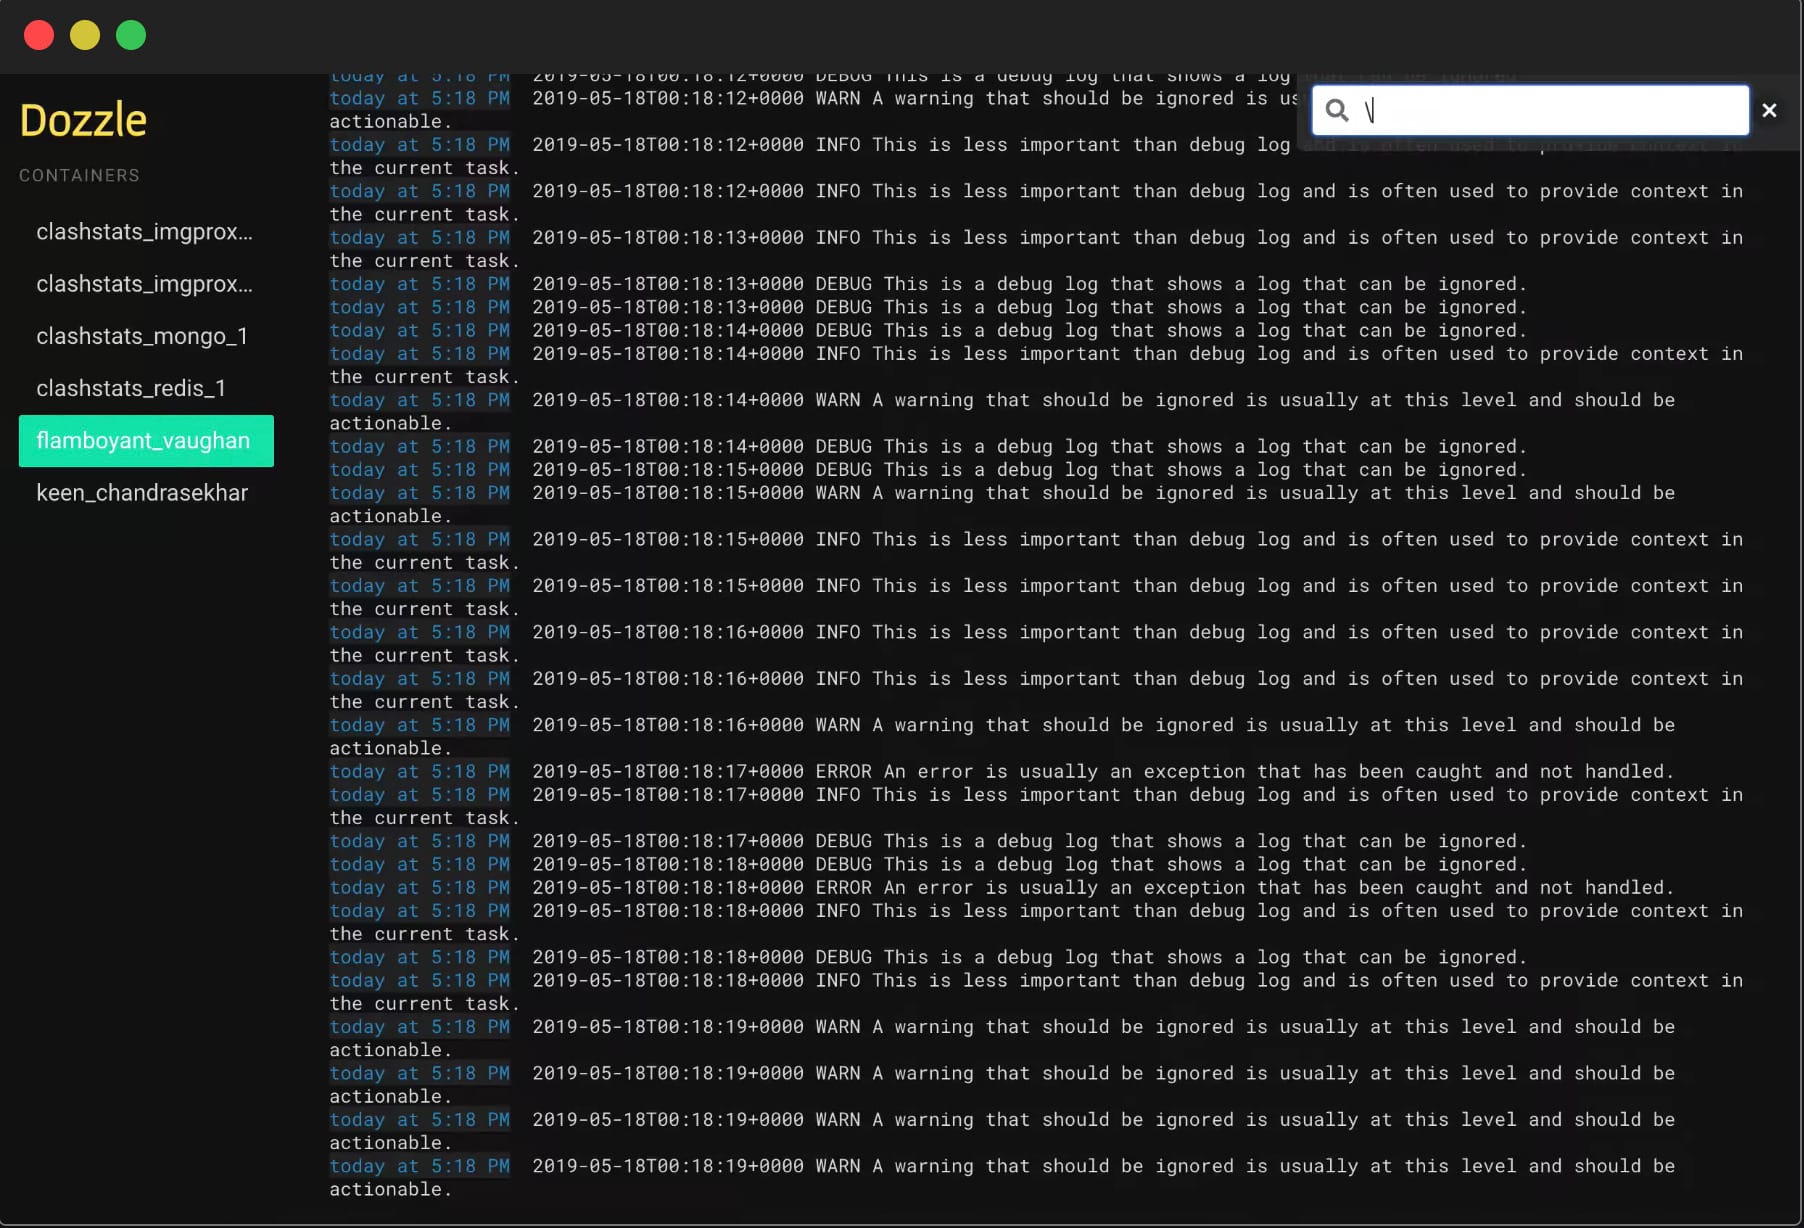
Next up I will explore how I create a dashboard that monitors container logs similar to Dozzle.