Beyond SpeedTest: Why Bufferbloat Matters More Than You Realize
Unlike Speedtest.net, Flent shows how networks behave under stress revealing bufferbloat. Find out how I use Flent and pfSense CoDel AQM to combat bufferbloat.
I often hear people say, 'My Speedtest result is fine, but my internet connection is still terrible!' This highlights the limitations relying simply on Speedtest results to check ISP-performance giving the number of non-ISP related factors that can impact a speedtest, like poor WiFi. While Speedtest results provide use information, it fails to capture a full report of network performance due to an issue known as bufferbloat.
- Beyond Speedtest: Why Bufferbloat Matters More Than You Realize
- References
Limitations of Speedtesting
Most of us use Speedtest.net to check our internet connection. It provides a quick way to measure speed. It measures how fast data can be sent and received between your device and the test server, using your device's internet connection. MacMillan, Mangla, Richardson, & Feamster (2022, p. 3) highlighted several factors that can impact the speed test, including:
- Client platform: Consumer devices, most cases laptops and smartphones.
- Access medium: Wireless or wired link, typically Wi-Fi.
- Test server location: The speed test tool chooses a test server from its network of test servers.
Ookla Speedtest
Ookla Speedtest is one of the most widely used web-based speed test tools for measuring Internet connection performance. Speedtest.net measures the quality of the network connection by using different ping tests such as idle, download, and upload pings to determine the impact of network activity. (Overturf, 2023).
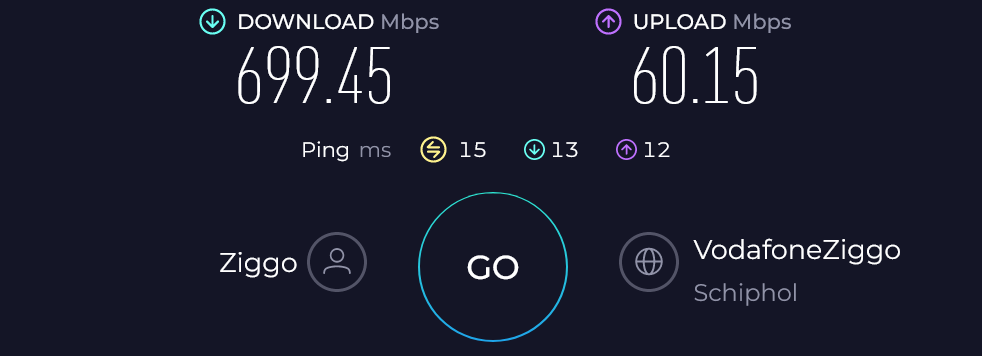
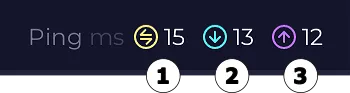
- Idle Ping: This test at the beginning of your Speedtest measures the response of a request on your network as if it is not in use.
- Download Ping: Is measured while the download test is in progress to see how it is affected by download activity on your network, like a household member downloading a large game while you’re trying to work.
- Upload Ping: Is also measured while the upload test is in progress to see how it is affected by upload activity on your network, like someone on your home network uploading a year’s worth of photos.
Web Speedtesting and its Limitations
The overhead introduced by the browser and environmental factors like network congestion can alter results, adding to the difficulty in interpreting the data accurately. The methodologies used by these tests are often unclear, preventing researchers from effectively utilizing the data for detailed studies. (Yang et al., 2022).
While these results are useful, it focuses on throughput. That's why we need to go beyond the traditional speedtest and explore latency and its impact on the quality of user experience. High latency has significant impact on latency-sensitive applications such as video conferencing and online gaming. It has negative effects on the quality of experience activities such as web browsing, video streaming applications and remote work.
Bufferbloat: The Hidden Culprit Behind High Latency and Poor User Experience
Bufferbloat happens when a router’s buffer becomes overloaded with too many data packets waiting to be sent. While buffering helps to reduce data packet loss, excessively large buffers can cause significant delays and degrade performance (Harrison, 2023, p. 1).
Applications seem "laggier" and users perceive the network as being slower and less responsive, this is especially noticeable with interactive applications such as web browsing, VoIP, and online gaming. Activities such as copying files over the internet, uploading videos, or running file-sharing application like Bittorrent can cause these buffers to fill up excessively (Gettys, J, 2012, p. 7).
High latency, a key factor of bufferbloat, leads to a worse quality of experience (QoE) in several applications, such as online gaming sessions and search engine results.
Gaming
Player performance and quality of experience in Counter Strike: Global Offensive both improve linearly as latencies decrease from 125ms to 25ms. Player scores at 25 ms will average 20% higher than player scores at 125 ms, comparable to 5 extra kills or 10 extra assists in a 4-minute game (Liu, Claypool, Kuwahara, Sherman, & Scovell, 2021, p. 11).
Search engine performance
While users may not consciously perceive it, the interaction on a search result page significantly influences the overall quality of experience, especially when latency increases by under 500ms. Even small increments in latency lead to a notable decrease in user interaction with the search result page. (Barreda-Ángeles, Arapakis, Bai, Cambazoglu, & Pereda-Baños, 2015, p. 3)
When users are presented with two content-wise identical search result pages, users are more likely to interact with result page that is served with lower latency. (Bai, Arapakis, Cambazoglu, & Freire, 2017, p. 41)
The Solution: Active Queue Management
Active Queue Management (AQM) is way to control network traffic to keep things running smoothly. Instead of waiting until the network is congested and packets start getting dropped, AQM tries to spot this congestion early on and deal with it before network performance declines and latency increases, leading to more stable and efficient network performance (Adams, 2013, p. 1).
What is CoDel
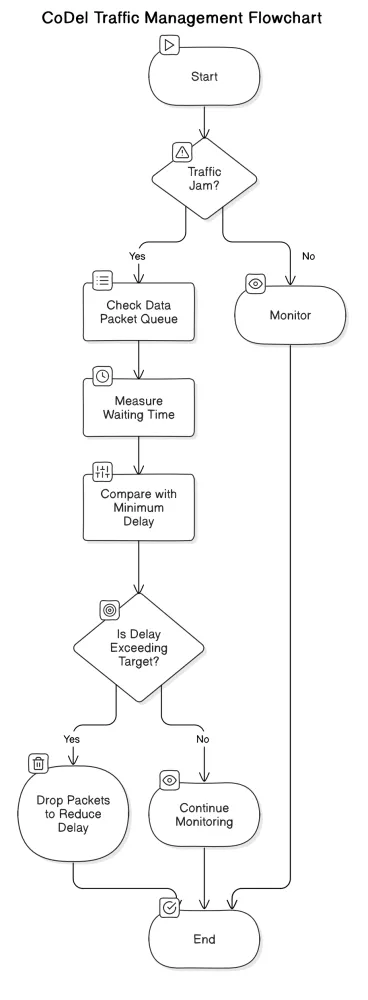
CoDel is an active queue management (AQM) technique used to manage internet traffic and reduce delays. It was designed by Van Jacobson and Kathleen Nichols to overcome bufferbloat in networking hardware (Nichols & Jacobson, 2012, pp. 45–46). Later in 2012 it was made available as open-source software.
We can think of CoDel as a smart traffic light system that controls the flow of cars to prevent traffic jams, it works by setting a target wait time for data packets. If packets wait too long, CoDel will start dropping some to reduce congestion. It will automatically change the wait times in a calculated way, if the wait times at the traffic lights improve, it stops making cars waiting longer.
Why It's Useful
By focusing on reducing wait times rather than the number of cars waiting, CoDel makes the internet faster and more responsive for users, similar to how efficient traffic management makes driving more pleasant.
How to test for Bufferbloat
Flent: The FLExible Network Tester is a tool designed to evaluate networks and works by composing well-known benchmarking tools, primarily targeted at testing for the presence of bufferbloat under various conditions (Høiland-Jørgensen et al., 2017, p. 1). To effectively test for this issue requires Real-Time Respone Under Load (RRUL). This test was developed by the bufferbloat community (Høiland-Jørgensen et al., 2017, p. 1), specifically to stress-test networks.
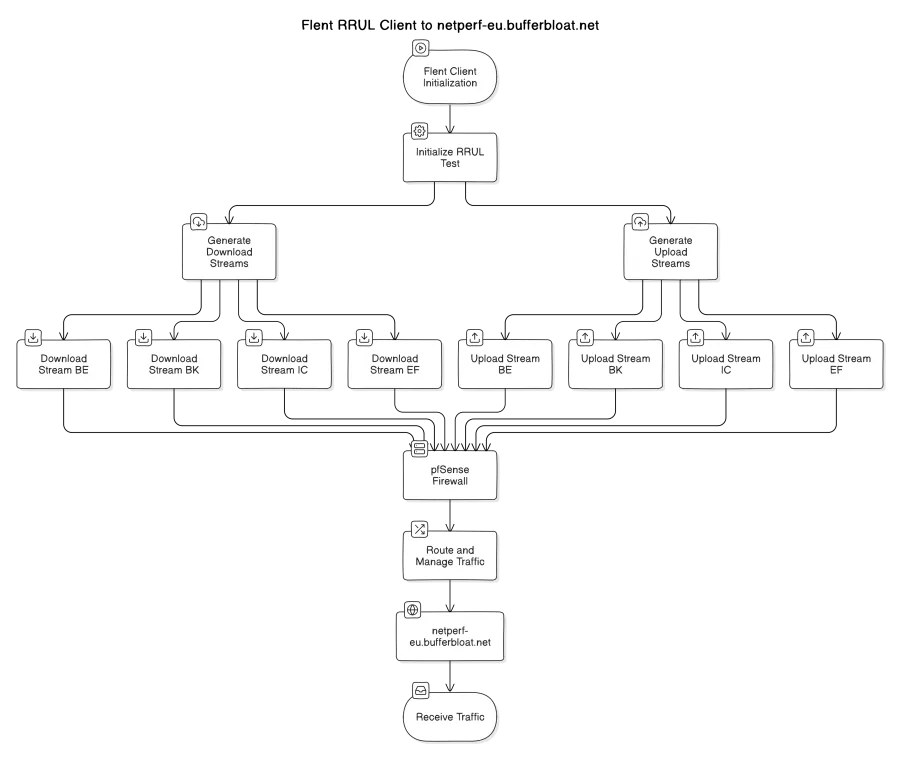
It works by running RTT measurement using ICMP ping and UDP roundtrip time measurement, while loading up the link with eight TCP streams (four downloads, four uploads). This saturates the link and therefore exposes bufferbloat when it is preset. The important thing to note is that four TCP streams for download and four TCP streams for upload are created simultaneously, not separately as in other traditional speed testing. Figure 1 shows the Flent RRUL Client to netperf-eu.bufferbloat.net test.
Flent RRUL Setup
When you use flent on the client, it will connect to the specified netserver (-H) and carry out the measurements. The following command is used to create an image to show down/upload speeds plus latency in three seperate charts:
flent rrul -p all -l 60 -H netperf-eu.bufferbloat.net -o /home/rudolf/RRUL_all_*.png
According to Høiland-Jørgensen (2016; bufferbloat.net) the RRUL test runs for 70 seconds by default: 5 seconds of idle (to give a baseline), 60 seconds of full-rate data transfer, and 5 more seconds of idle. A three-plot RRUL Chart shows:
- Download plot showing the average download speed (Mbits/sec, in black) of the four diffserv connections (individual colors.) Multiply the average by four to get the actual throughput/link speed.
- Upload plot showing the average upload speed (Mbits/sec, black) of the four diffserv class connections (individual colors.) Multiply the average by four to get the actual throughput/link speed.
- Latency plot showing the average latency (msec, in black) of all the connections.
- Horizontal axis for all plots is seconds, across the test duration.
Flent RRUL Results
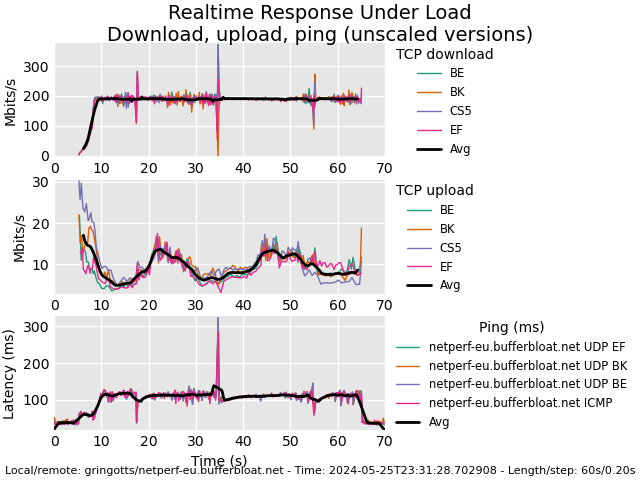
Chart A shows the plot of the RRUL test to netperf-eu.bufferbloat.net without CoDel enabled. It shows poor latency control average around 100 ms with a spike to 300 ms. The Download plot average is stable, but we see a very unstable Upload plot that varies from 19 Mbits/s to around 9 Mbits/s
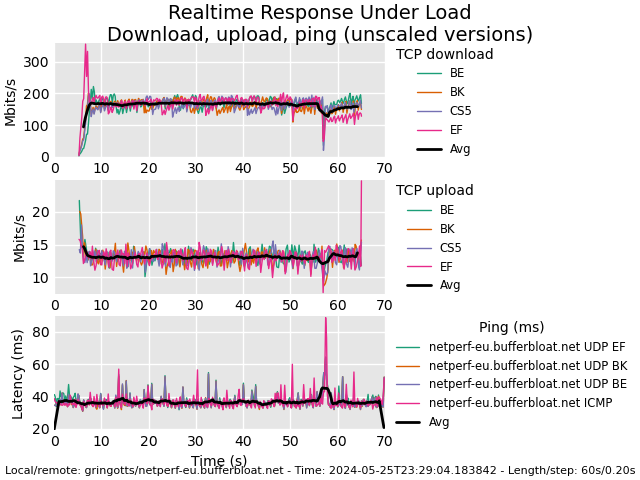
Chart B shows the plot of the RRUL test to netperf-eu.bufferbloat.net with CoDel enabled. It shows excellent latency control managing to keep latency at 40 ms. The Upload plot is greatly improved keeping it at a stable average of 14 Mbit/s without any major deviation compared with CoDel disabled.
Note:
"The measured download and upload rates tend to be lower than the full rated speed of the ISP connection. This is because the TCP Ack traffic uses a significant fraction (often as much as 20%) of the capacity in the opposite direction. This does not skew RRUL results, because all tests will have the same testing conditions (Høiland-Jørgensen, 2016; bufferbloat.net)."
Conclusion
In conclusion, bufferbloat is an complex and often overlooked aspect of the overall internet quality of experience. It demonstrates that enabling CoDel has a significant positive impact on the network's ability to handle traffic more efficiently, reducing delays and improving the overall quality of experience, which for gamers and anyone relying on real-time internet applications, can dramatically enhance their experience.
Latency improves by 60% from 100ms to 40ms, and the upload speed improves by approximately 40% under full load using Flent RRUL showing the effectiveness of CoDel. This is further highlighted by the linear increase of 20% in player performance observed in Counter Strike: Global Offensive and the significant increase in the quality of experience for search engine interactions.
References
Adams, R. (2013). Active Queue Management: A Survey. IEEE Communications Surveys & Tutorials, 15(3), 1425-1476. https://doi.org/10.1109/SURV.2012.082212.00018
Bai, X., Arapakis, I., Cambazoglu, B. B., & Freire, A. (2017). Understanding and leveraging the impact of response latency on user behaviour in web search. ACM Transactions on Information Systems, 36(2), Article 21, 1–42. https://doi.org/10.1145/3106372
Barreda-Ángeles, M., Arapakis, I., Bai, X., Cambazoglu, B. B., & Pereda-Baños, A. (2015). Unconscious physiological effects of search latency on users and their click behaviour. In Proceedings of the 38th International ACM SIGIR Conference on Research and Development in Information Retrieval (pp. 203–212). https://doi.org/10.1145/2766462.2767719
Gettys, J., & Nichols, K. (2012). Bufferbloat: Dark Buffers in the Internet. Journal Name, 55(1). https://dl.acm.org/doi/pdf/10.1145/2063176.2063196
Harrison, P. (2023). Buffer-Bloated Router? How to Prevent It and Improve Performance. Communications of the ACM, 66(6), 73–77. https://doi.org/10.1145/3564262
Høiland-Jørgensen, T., Grazia, C. A., Hurtig, P., & Brunstrom, A. (2017). Flent: The FLExible Network Tester. In Proceedings of the 11th EAI International Conference on Performance Evaluation Methodologies and Tools (VALUETOOLS 2017) (pp. 120–125). Association for Computing Machinery. https://doi.org/10.1145/3150928.3150957
Høiland-Jørgensen, T. (2016, December 27). Explaining RRUL Charts. Retrieved from https://www.bufferbloat.net/projects/bloat/wiki/RRUL_Chart_Explanation/
Khademi, N., Ros, D., & Welzl, M. (2014). The new AQM kids on the block: An experimental evaluation of CoDel and PIE. In 2014 IEEE Conference on Computer Communications Workshops (INFOCOM WKSHPS) (pp. 85-90). IEEE. https://doi.org/10.1109/INFCOMW.2014.6849173
Liu, S., Claypool, M., Kuwahara, A., Sherman, J., & Scovell, J. J. (2021). Lower is Better? The Effects of Local Latencies on Competitive First-Person Shooter Game Players. In CHI '21: Proceedings of the 2021 CHI Conference on Human Factors in Computing Systems (pp. 1–12). Article No.: 326. https://doi.org/10.1145/3411764.3445245
MacMillan, K., Mangla, T., Richardson, M., & Feamster, N. (2022). Best Practices for Collecting Speed Test Data. Retrieved from SSRN: https://ssrn.com/abstract=4189044 or http://dx.doi.org/10.2139/ssrn.4189044
Nichols, K., & Jacobson, V. (2012). Controlling queue delay. Communications of the ACM, 55(7), 42–50. https://doi.org/10.1145/2209249.2209264
Netgate Docs. (2024, April 3). Configuring CoDel Limiters for Bufferbloat. Retrieved from https://docs.netgate.com/pfsense/en/latest/recipes/codel-limiters.html
Overturf, C. (2023). How can I determine the quality of my connection? Speedtest.net. Retrieved from https://help.speedtest.net/hc/en-us/articles/360038679454-How-can-I-determine-the-quality-of-my-connection
Yang, R., Mok, R. K. P., Wu, S., Luo, X., Zou, H., & Li, W. (2022). Design and Implementation of Web-Based Speed Test Analysis Tool Kit. In O. Hohlfeld, G. Moura, & C. Pelsser (Eds.), Passive and Active Measurement (pp. 83–96). Cham: Springer International Publishing. https://doi.org/10.1007/978-3-030-98785-5_4